OK.Wahl
Internetpräsentation
Version 2.2.10
Schnellmeldung zur Landtagswahl 2018 am 14.10.2018
Landkreis Neumarkt - Markt Lauterhofen
Es wurden alle Stimmbezirke ausgewertet.
 Diagramm
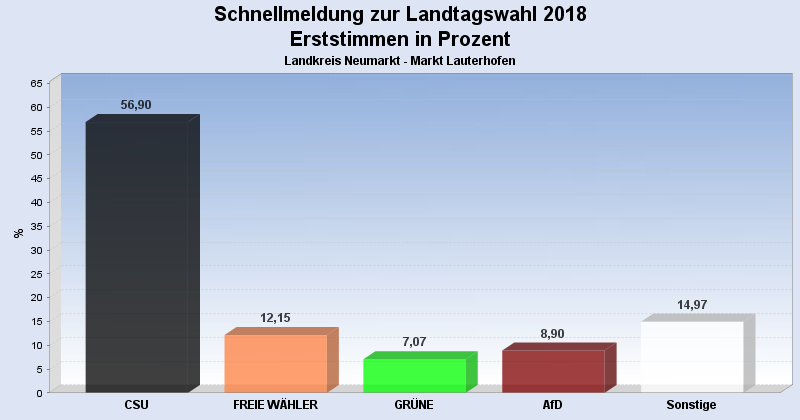
 Seitenanfang
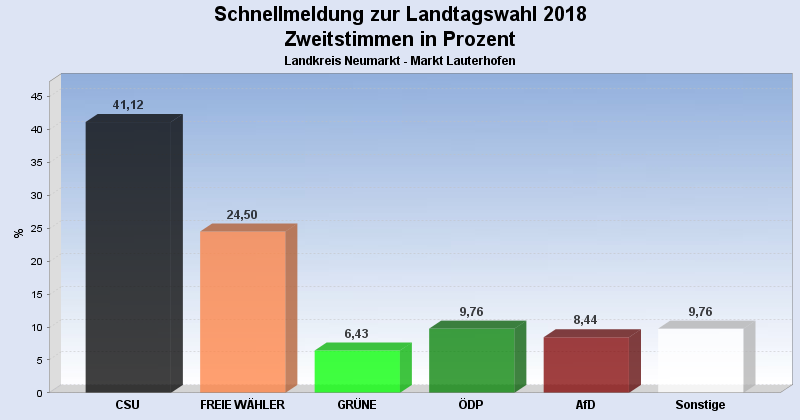
Wahlbeteiligung, Stimmzettel, Stimmen
| Wahlbeteiligung: | 82,55% |
|---|---|
| Stimmberechtigte: | 2.814 |
| Wähler: | 2.323 |
| Ungültige Erststimmen: | 19 |
| Gültige Erststimmen: | 2.304 |
| Ungültige Zweitstimmen: | 37 |
| Gültige Zweitstimmen: | 2.286 |
Erststimmen nach Wahlvorschlag
| Partei | Erststimmen | Prozent | |
|---|---|---|---|
| 1 | Füracker, Albert ( CSU ) | 1.311 | 56,90% |
| 2 | Madeisky, Andre ( SPD ) | 84 | 3,65% |
| 3 | Penkala, Matthias ( FREIE WÄHLER ) | 280 | 12,15% |
| 4 | Hauff, Siegfried ( GRÜNE ) | 163 | 7,07% |
| 5 | Gründer, Nils ( FDP ) | 49 | 2,13% |
| 6 | Emmerling, Tobias ( DIE LINKE ) | 44 | 1,91% |
| 7 | Koll-Pfeifer, Alexander ( BP ) | 51 | 2,21% |
| 8 | Neumeyer, Joseph ( ÖDP ) | 109 | 4,73% |
| 10 | Meier, Werner ( AfD ) | 205 | 8,90% |
| 13 | Kellner, Christine ( Gesundheitsforschung ) | 8 | 0,35% |
Zweitstimmen nach Wahlvorschlag
| Partei | Zweitstimmen | Prozent | |
|---|---|---|---|
| 1 | CSU | 940 | 41,12% |
| 2 | SPD | 62 | 2,71% |
| 3 | FREIE WÄHLER | 560 | 24,50% |
| 4 | GRÜNE | 147 | 6,43% |
| 5 | FDP | 39 | 1,71% |
| 6 | DIE LINKE | 36 | 1,57% |
| 7 | BP | 46 | 2,01% |
| 8 | ÖDP | 223 | 9,76% |
| 9 | PIRATEN | 8 | 0,35% |
| 10 | AfD | 193 | 8,44% |
| 11 | mut | 3 | 0,13% |
| 12 | Die PARTEI | 23 | 1,01% |
| 13 | Gesundheitsforschung | 3 | 0,13% |
| 14 | V-Partei³ | 3 | 0,13% |
- Stand: 14.10.2018 20:34:26